Market Stats
We have been tracking our market since 2004, see what has happened since then.
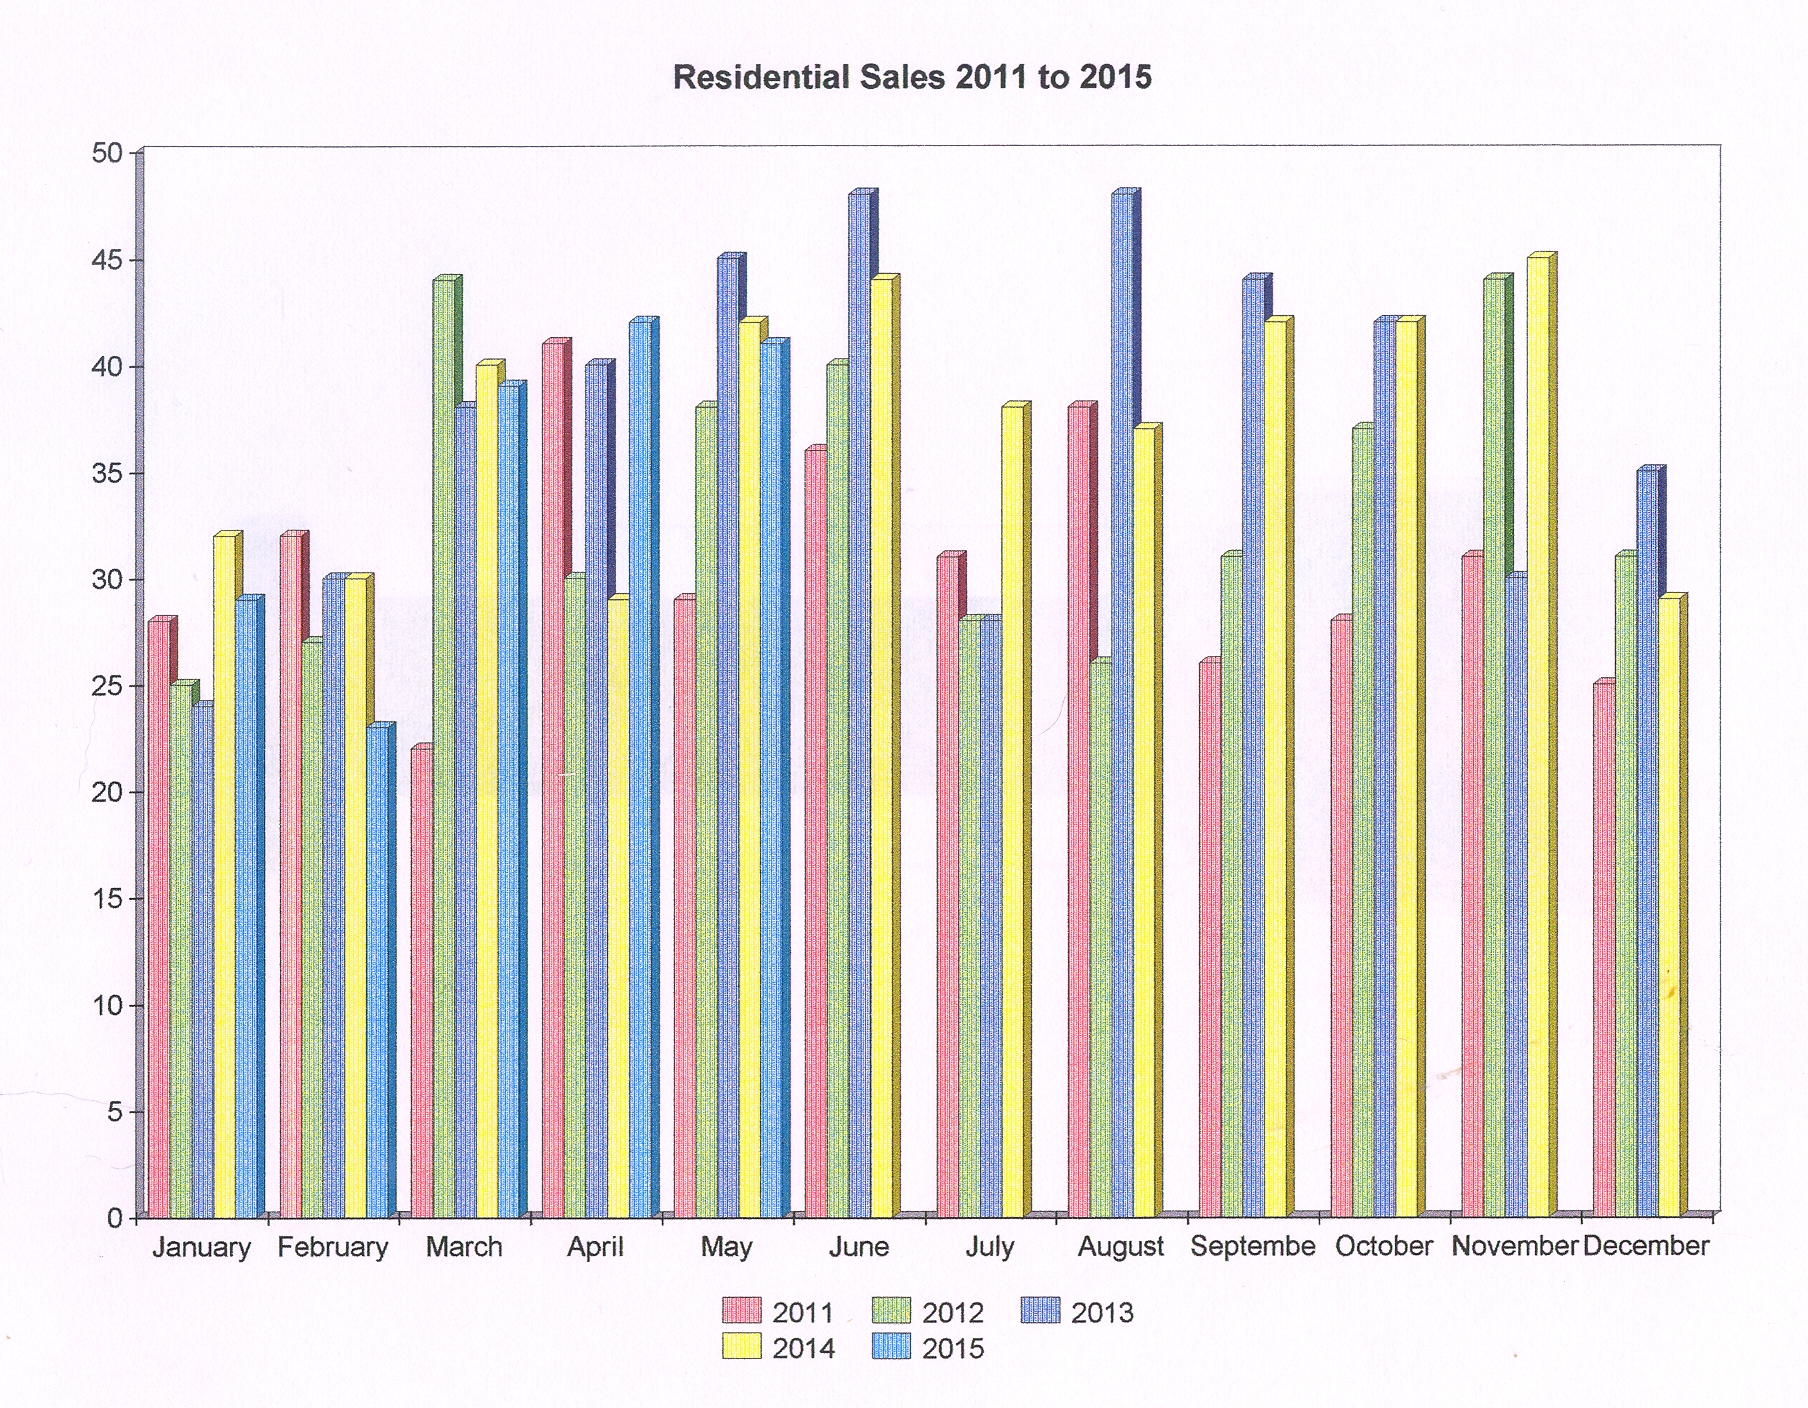
Residential Sales ONLY.
We have had a lot of response to this chart, and some have suggested that the actual numbers would benefit them to see how the market has been responding. So for those of you that would rather see the numbers in a table format....here they are.
2004 |
2005 |
2006 |
2007 |
2008 |
2009 |
2010 |
2011 |
2012 | 2013 | 2014 | 2015 |
|
| January | 33 |
32 |
60 |
35 |
31 |
30 |
20 |
28 |
25 |
|||
| February | 36 |
46 |
48 |
34 |
29 |
22 |
20 |
32 |
27 |
|||
| March | 36 |
52 |
75 |
52 |
35 |
35 |
37 |
22 |
44 |
|||
| April | 61 |
48 |
57 |
38 |
37 |
25 |
32 |
41 |
30 |
|||
| May | 59 |
55 |
77 |
41 |
42 |
35 |
36 |
29 |
38 |
|||
| June | 58 |
54 |
78 |
53 |
41 |
27 |
28 |
36 |
40 |
|||
| July | 49 |
52 |
65 |
48 |
26 |
39 |
27 |
31 |
28 |
|||
| August | 53 |
54 |
67 |
52 |
32 |
27 |
27 |
38 |
26 |
|||
| September | 46 |
25 |
47 |
33 |
32 |
37 |
29 |
26 |
31 |
|||
| October | 34 |
96 |
52 |
49 |
32 |
40 |
26 |
28 |
37 |
|||
| November | 35 |
109 |
43 |
40 |
31 |
39 |
23 |
31 |
44 |
|||
| December | 40 |
102 |
45 |
38 |
31 |
32 |
27 |
25 |
31 |
This information is based on the local Pearl River Board MLS stats, residential sales ONLY.
This information will be updated on a bi-monthly time frame as to allow all agents ample time to supply the information to the MLS.
NEW FEATURE**** I will be adding market reports which will give a much more detailed insight as to what has been happening month by month and year by year. This is a work in progress. Please let us know if this feature is benefical to you.
If you would like further information, such as average sales price, Days On Market, or other information, please contact us and we will be happy to send you the information.
![]()
Last updated on
11/12/15.
Webmaster: Pam Brister